Today’s art is a simple infographic showing our total carbon budget, and how much we have left. I’m posting this so everyone is aware of what is being negotiated in less than one month’s time at the COP21 meetings in Paris. This simple graphic contains the most basic, and yet most important information to understand about climate change, and the upcoming meetings.
We have a total carbon budget we can burn and still keep the total increase in temperature 2C or less above the average global temperature from 1850-1900. Scientists have agreed that anything over 2C is catastrophic, although some are saying anything over 1.5C would catastrophic given the problems we already have (we’re currently .85-1C above the 1850-1900 average).
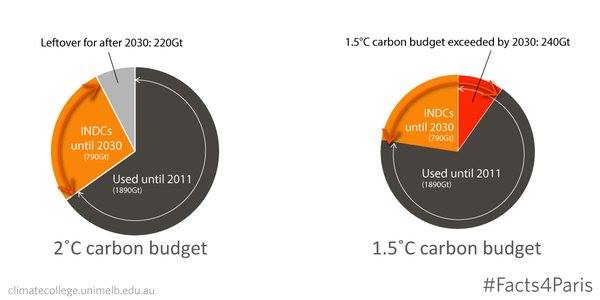
Since 1850, we have used up over half of our budget; not quite two thirds. That means we don’t have much room left in the budget. And unfortunately, because of population growth and development, we use up more of that budget every year (we “spend” more carbon every year).
An INDC is an Intended Nationally Determined Contribution from a country to reduce CO2 emissions. So far 129 INDCs have been submitted by countries around the world (here they are, if you’re interested). These are non-binding pledges to reduce CO2 emissions. If all of these countries actually implemented all of these pledges and were successful, then we would use up most of the rest of our carbon budget for 2C by 2030, and we’d blow through the budget for 1.5C.
That is what we’re facing. This is why we have to get serious about climate change. And this is why we have start planning for a future without fossil fuels immediately. If we don’t, we’re looking at a catastrophe.
Recent Comments